2020
Mapping Spain’s Healthcare System
Data science and urban analytics have been key tools to understand the COVID-19 outbreak over the last years. At IAAC’s Advanced Architecture Group’s Big Data Urbanism team we explored the pandemic outbreak in Spain by creating a series of maps, visualising Spain’s hospital infrastructure, its risk areas, the optimum routes to hospitals according to where one is located as well the number of ICUs per affected habitat in one area.

Year:
- 2020
Project Leader:
- Areti Markopoulou
Research and Coordination:
- Alex Mademochorits
Data Visualisation:
- Iacopo Neri
Maps from 1 to 4:
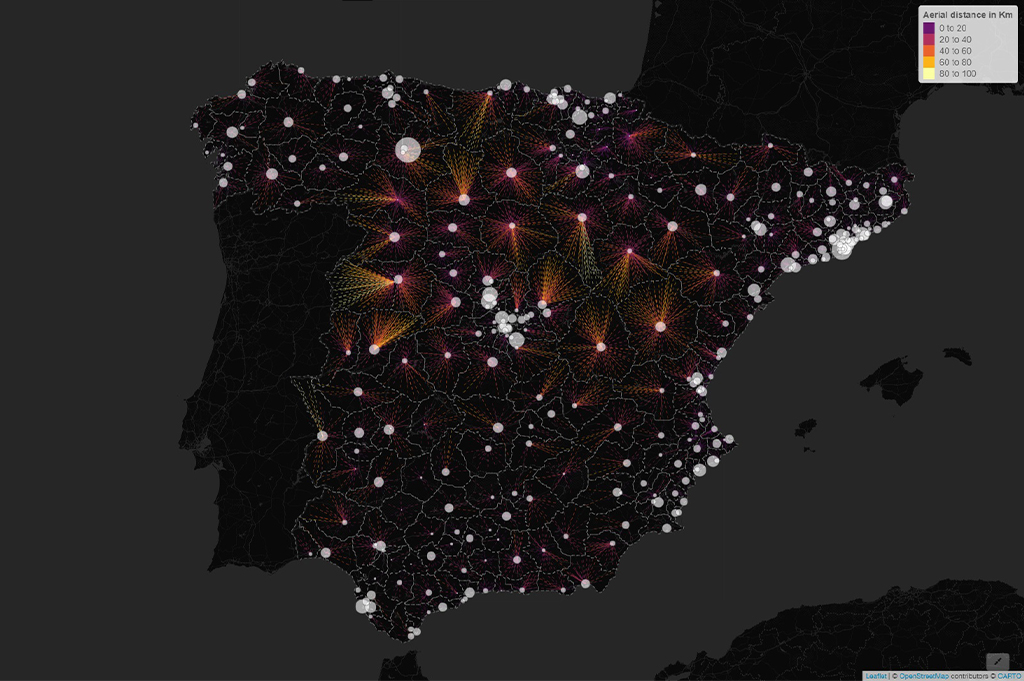
Accessibility to hospitals and absolute capacity
The map reports the location of the Spanish healthcare nodes with their hosting capacity and reachability in their surrounding territory. Starting from the hospitals and based on the road infrastructure plus the terrain morphology, a cumulative cost analysis is conducted in order to visualize their degree of accessibility. This map highlights the geolocalized unbalances of the national healthcare system and functions as a base to draw the hospital catchment areas.
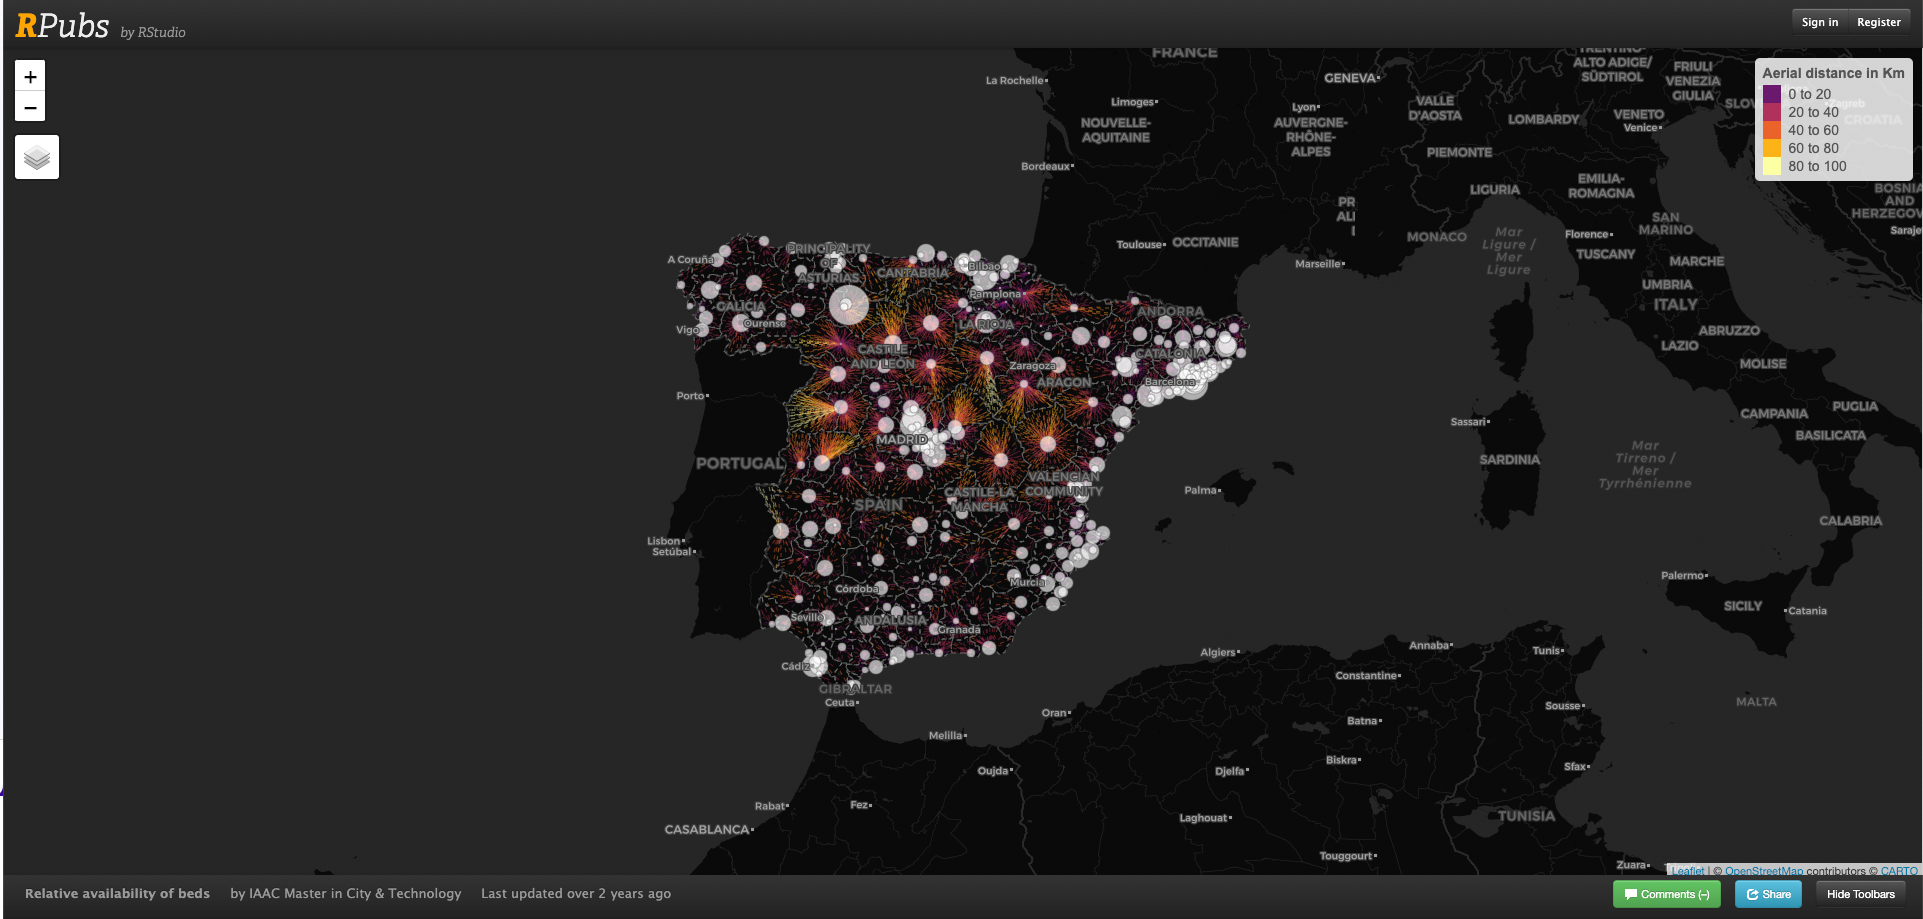
Relative availability of beds and Intensive care units
The map reports the location of the Spanish healthcare nodes with their relative availability of beds and ICUs in relation to the number of citizens they serve by proximity. The radius of the circles is representative of the number of beds in the hospital per 1000persons, while the color shows the availability of ICUs. The latter is mapped from regional data.
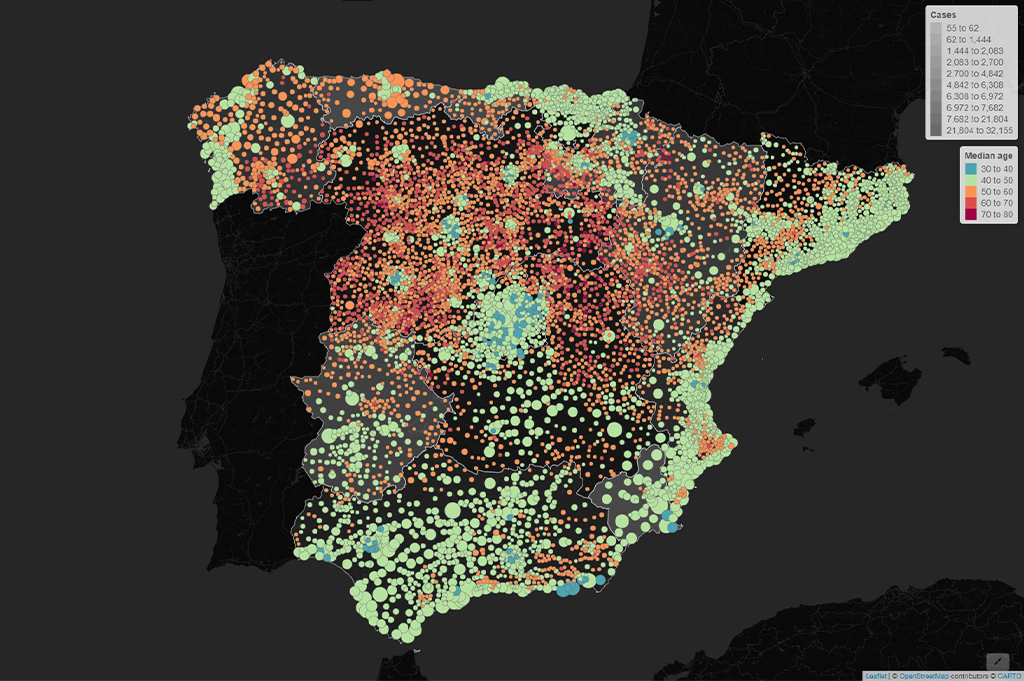
COVID-19 cases and Demography
The map reports the number of COVID-19 cases per region. Moreover, a dot map highlights the municipalities at a higher risk in consideration to the total population (the radius of the circles) and the median age ( from brighter to darker).
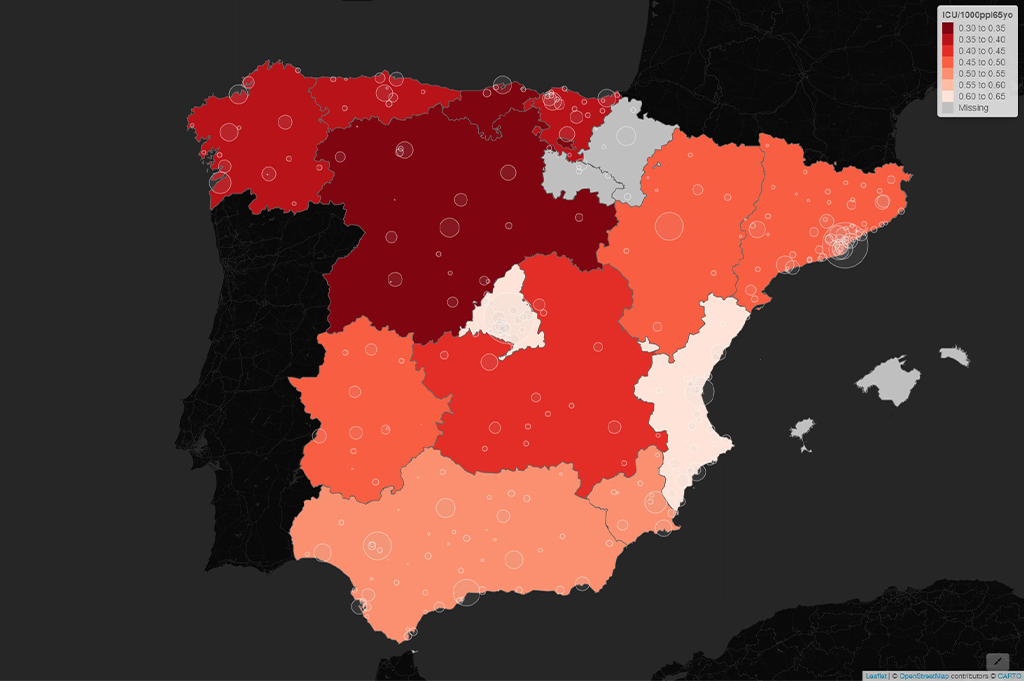
Spain’s regional healthcare system
The map reports data about the regional healthcare infrastructure. Demographic data is reported aggregated by region.